The Trunk and Branch Theory of Computation
A speculative framework for thinking about how computation grows through hierarchical structures rather than uniform depth.
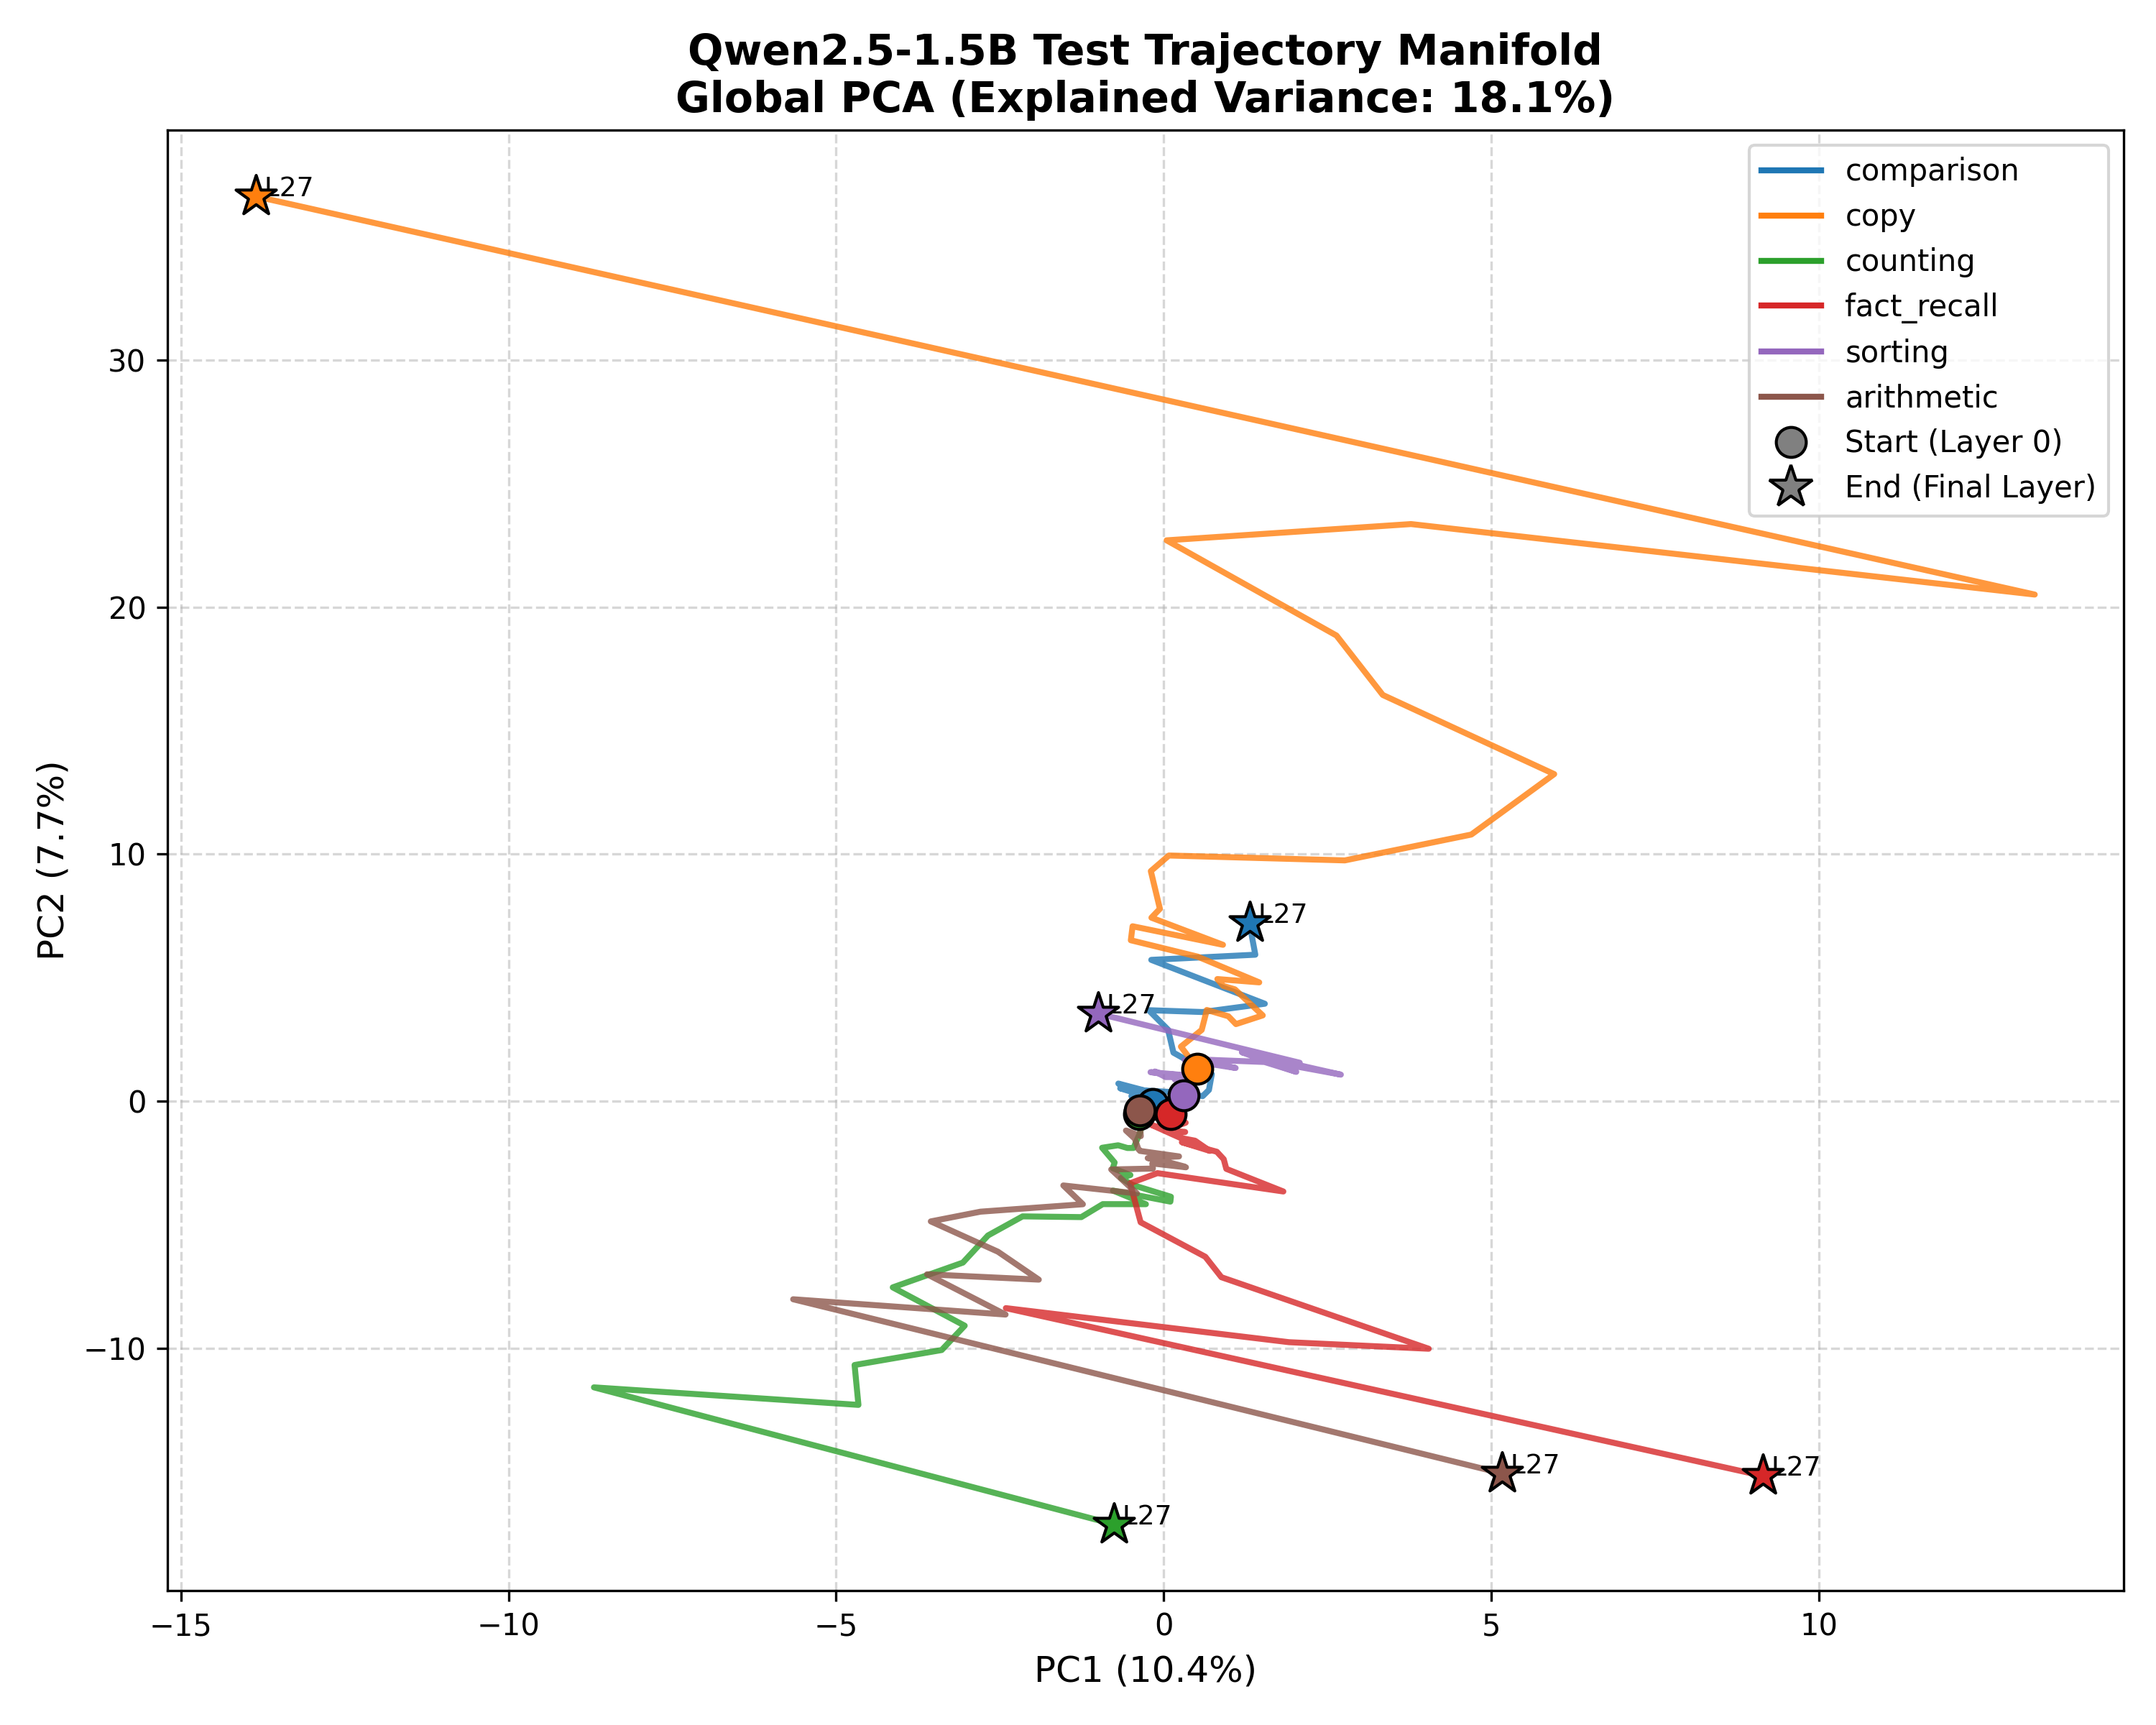
Independent research post walking through a falsification arc: expecting a hardware ISA inside transformers, finding residual stream geometry, testing if geometry is the causal mechanism, and discovering what actually survived.
TL;DR
When a language model solves different kinds of problems (arithmetic, sorting, copying, comparison, counting, fact recall), it builds a real, measurable internal “map” of which kind of problem it’s solving. That map is conserved across different models. But the map itself is not the mechanism that produces the behavior.
Where This Sits Relative to Existing Work
“Residual stream as a geometric trajectory” is an active area right now. Before reading further, it’s worth knowing what’s already out there—both because I’m building on it and because the differences matter for what you should trust in this post.
- Transformers Represent Belief State Geometry in their Residual Stream (LessWrong, Shai et al., 2025)
- Curved Inference: Concern-Sensitive Geometry in LLM Residual Streams (Manson, 2025, arXiv:2507.21107): Tracks how the residual stream trajectory bends (curvature) and how fast it moves (salience) in response to shifts in semantic concern, across Gemma3 and Llama3.2. Frames inference as a continuous trajectory through residual space shaped by attention and MLP updates.
- Geometric Evolution Maps (Henry, 2026, arXiv:2605.25848) & An Analysis of Residual-Stream Geometry Across Transformer Depth (arXiv:2607.18348): Geometric analyses of how representations move layer to layer.
- The Logit Lens (nostalgebraist, 2020) & Tuned Lens: Foundational prior art for decoding the residual stream at intermediate layers.
What is new here:
- The trunk-and-branch framing itself: multiple task categories start from a shared origin point and progressively diverge into distinct geometric paths, quantified with the F-ratio (between-category spread over within-category spread) rather than just visualizing from a PCA plot, shown across three architectures via CKA plus DTW with a time-shuffle null control.
- The causal sufficiency test on that structure, which catches its own false positive via a degenerate repetition loop.
- The MLP-versus-attention-head decomposition of who constructs the trajectory, with a norm-artifact check built in.
First, What is a Residual Stream?
Picture a transformer as a building with floors stacked on top of each other. You feed in a prompt like:
"Sort these numbers - 3, 77, 33, 7"
At each floor, the model holds a list of numbers (a vector) representing what it currently understands about the prompt. That list gets passed up to the next floor, gets modified a bit, and passed up again:
graph TD
    In["Input: 'Sort these numbers - 3, 77, 33, 7'"] --> F0["Floor 0: 'I see these tokens'"]
    F0 --> F5["Floor 5: 'This seems like some kind of task'"]
    F5 --> F10["Floor 10: 'This is probably sorting'"]
    F10 --> F15["Floor 15: 'I need to compare these numbers'"]
    F15 --> F20["Floor 20: 'I know how to produce the answer'"]
    F20 --> Out["Output Token"]
That evolving list of numbers is called the residual stream. It’s the model’s running notes to itself as it climbs the building. This is an additive process where each head and MLP adds its processed matrix to the stream.
The central question asked with increasing strictness at each step:
graph TD
    Q1["1. Do different task types move into different regions of internal space?"] -->|Yes| Q2["2. Is that separation real, or is PCA inventing it?"]
    Q2 -->|It's real| Q3["3. Does the same shape show up in a completely different model?"]
    Q3 -->|Yes| Q4["4. If I physically inject that shape, does it cause the behavior?"]
    Q4 -->|No. Not really.| Q5["5. Who inside the model actually builds this shape?"]
    Q5 -->|Mostly MLPs| Q6["6. Who reads it back out to produce the answer?"]
    Q6 -->|Nobody clean| Final["Result: Computation leaves a fingerprint, not a controllable switch."]
Part 0: Why I Stopped Looking for Hardware
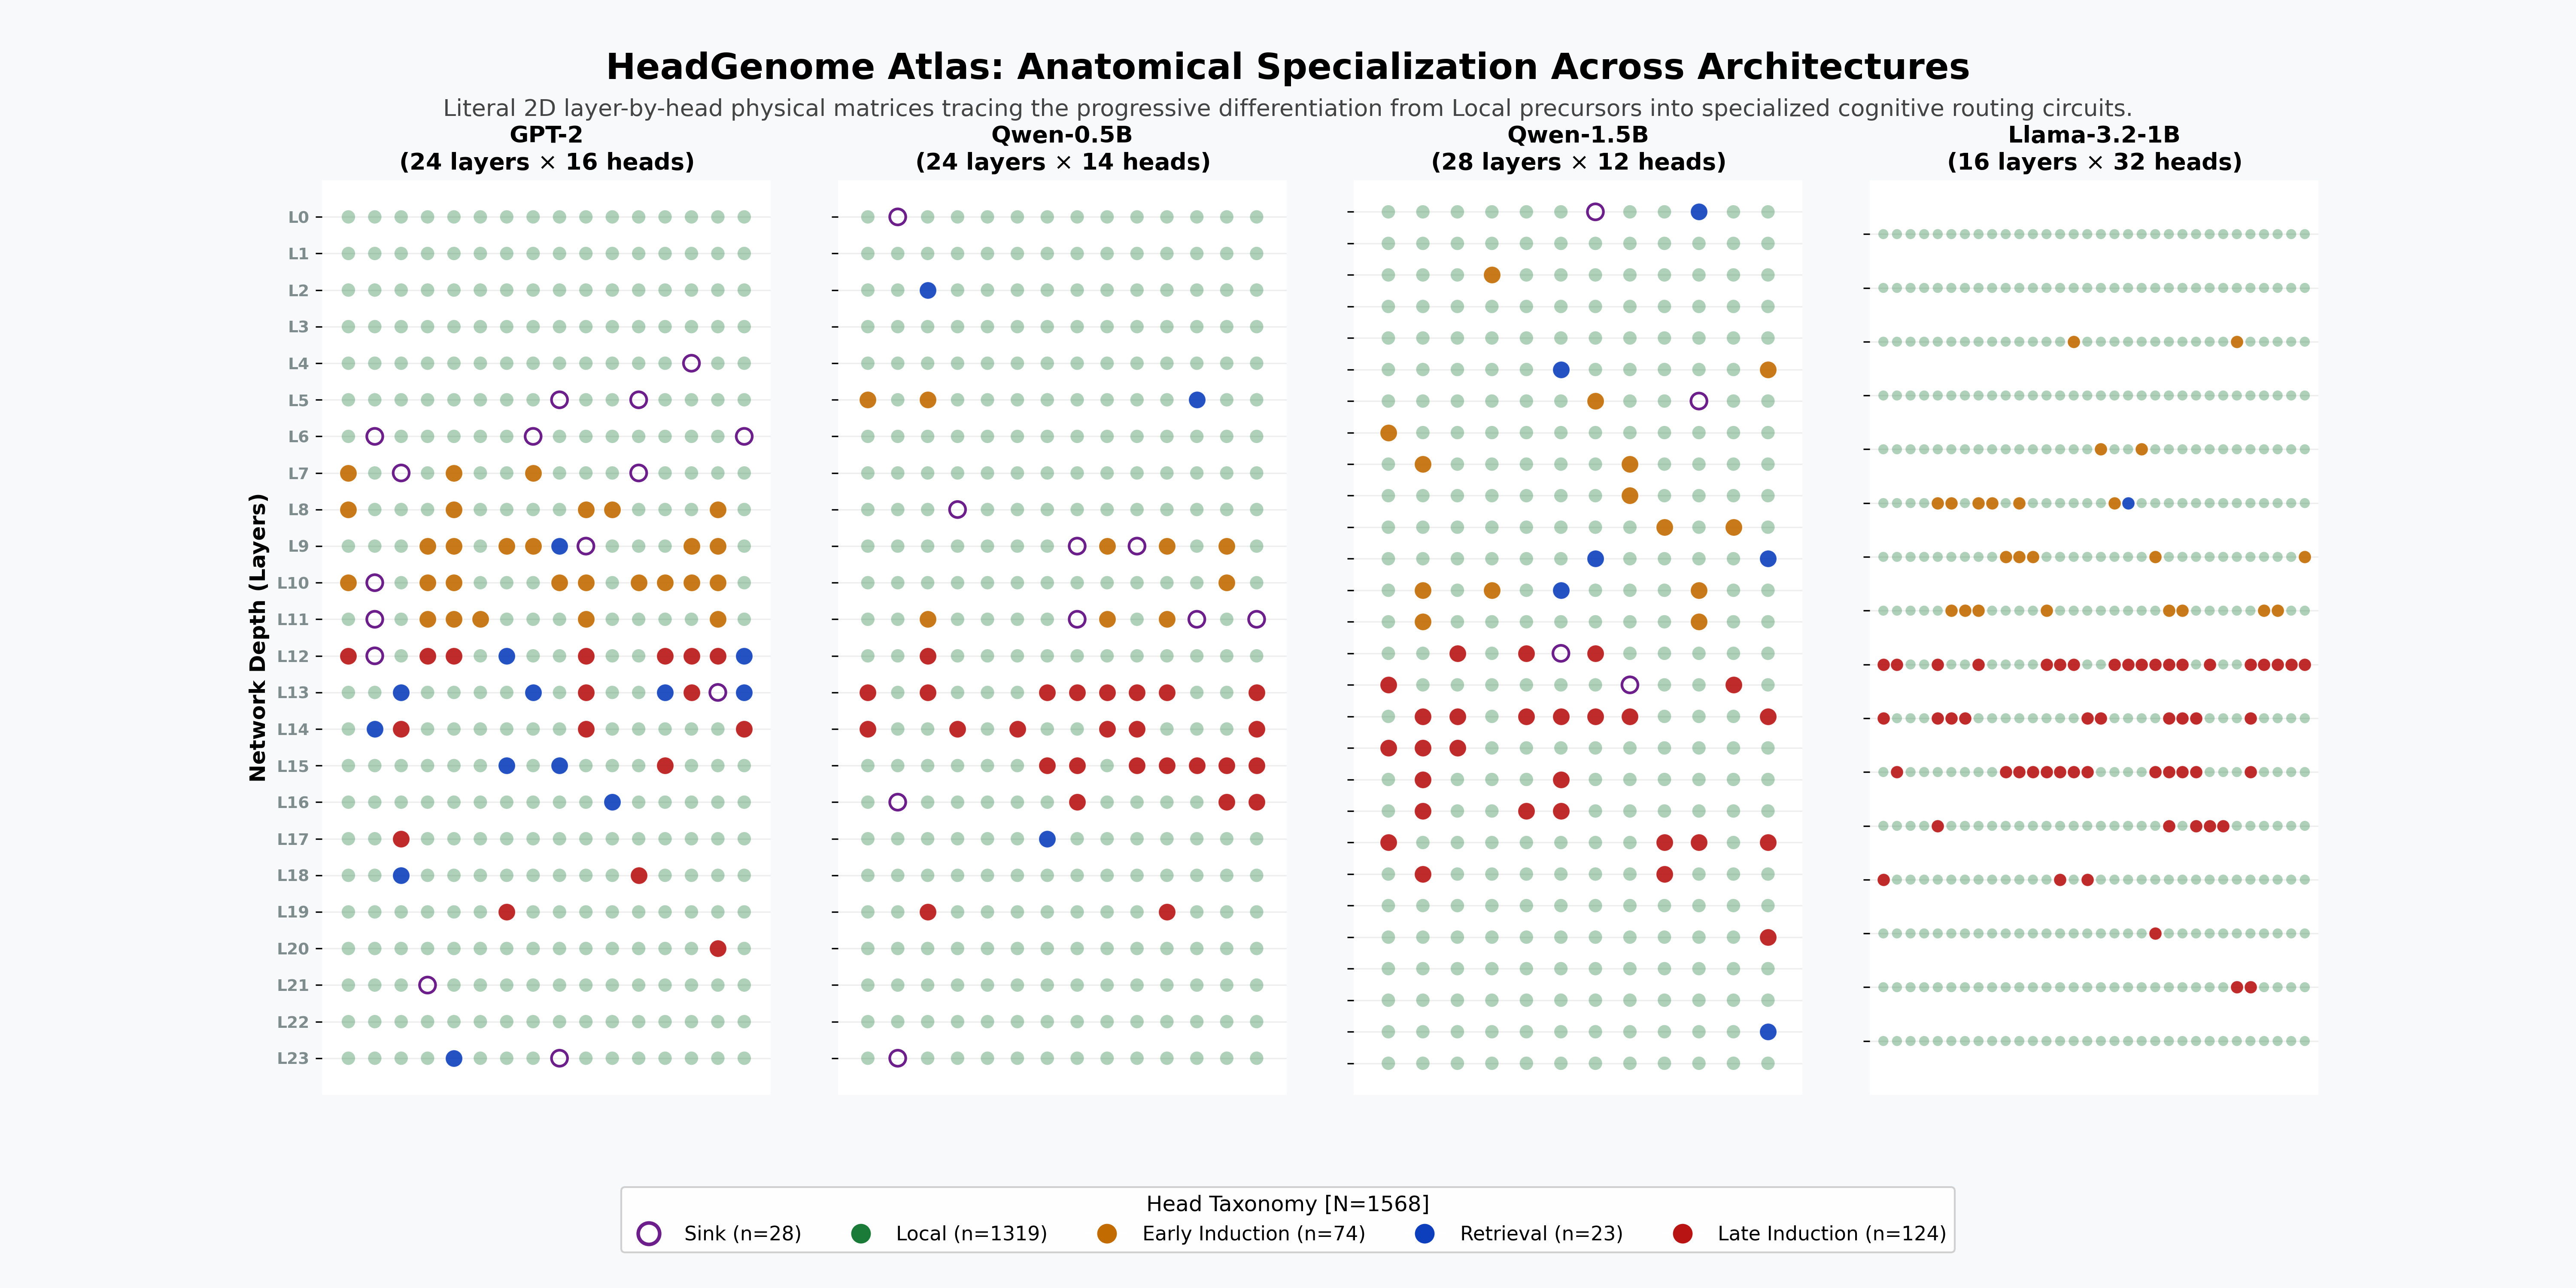
My first instinct was to look for a basic Instruction Set Architecture (ISA) inside transformers. If we find an ISA, we could apply selective attention types to heads and increase efficiency for prefill inference.
I tested this directly, 12 separate ways (in my previous paper, “Necessary but Not Sufficient”). All 12 broke:
- A head-level taxonomy that looked 86.5% accurate on paper turned out to be mostly a dominant “unclassified” bucket.
- “Attention heads write, MLPs compute” for fact recall in one model completely reversed in a different model. In Qwen, MLPs dominated 9.12 to 2.53. In Llama, attention dominated 21.9 to 6.9.
- Four heads that pointed 75% to 80% of their attention straight at a target string had zero effect when ablated (accuracy remained 48.0% $\rightarrow$ 48.0%).
- A circuit that passed a real causal test for Counting completely failed to transfer to Arithmetic.
Twelve rounds of “looks structural, dies under a causal test” pushed me off hardware entirely. If individual components don’t carry a stable instruction, maybe their output does.
The Pivot: Stop asking which wires do the computing; start asking whether computation has a shape.
Part 1: When Does the Model Know What Task It’s Doing?
Linear Probe, Explained Plainly
A linear probe is a simple classifier trained to look at the residual stream at one floor and guess: “Which task is this—arithmetic, sorting, copying, or fact recall?”
What Happened & Template Leakage
In my first attempt, the probe hit a suspicious 1.000 accuracy at layer 0—before the model had done any real computation! The prompts had shortcuts baked in: every Copy task literally started with the word “Repeat.” The probe was reading the dataset template, not the model’s cognition.
The Fix: I rebuilt the dataset so training and testing prompts used completely different templates and vocabulary, plus a length-only baseline.
Floor 0:  43% to 71% accuracy (above 16.7% chance rate)
Floor 5:  climbing
Floor 10: climbing
Floor 15: climbing
Floor 20: near ceiling
Where I pulled a claim back: I wanted to report one precise “onset floor” where task identity crystallizes. But rerunning on an independent random seed shifted Qwen’s onset floor from floor 17 to floor 20 ($\pm 3$). Because I pre-committed to a tolerance of $\pm 2$, I downgraded the claim.
- What survives: Task identity gradually emerges as you climb floors.
- What doesn’t survive: Trusting any single floor number down to the exact digit.
Part 2: What Does “Emerging” Actually Look Like?
PCA & Explained Variance
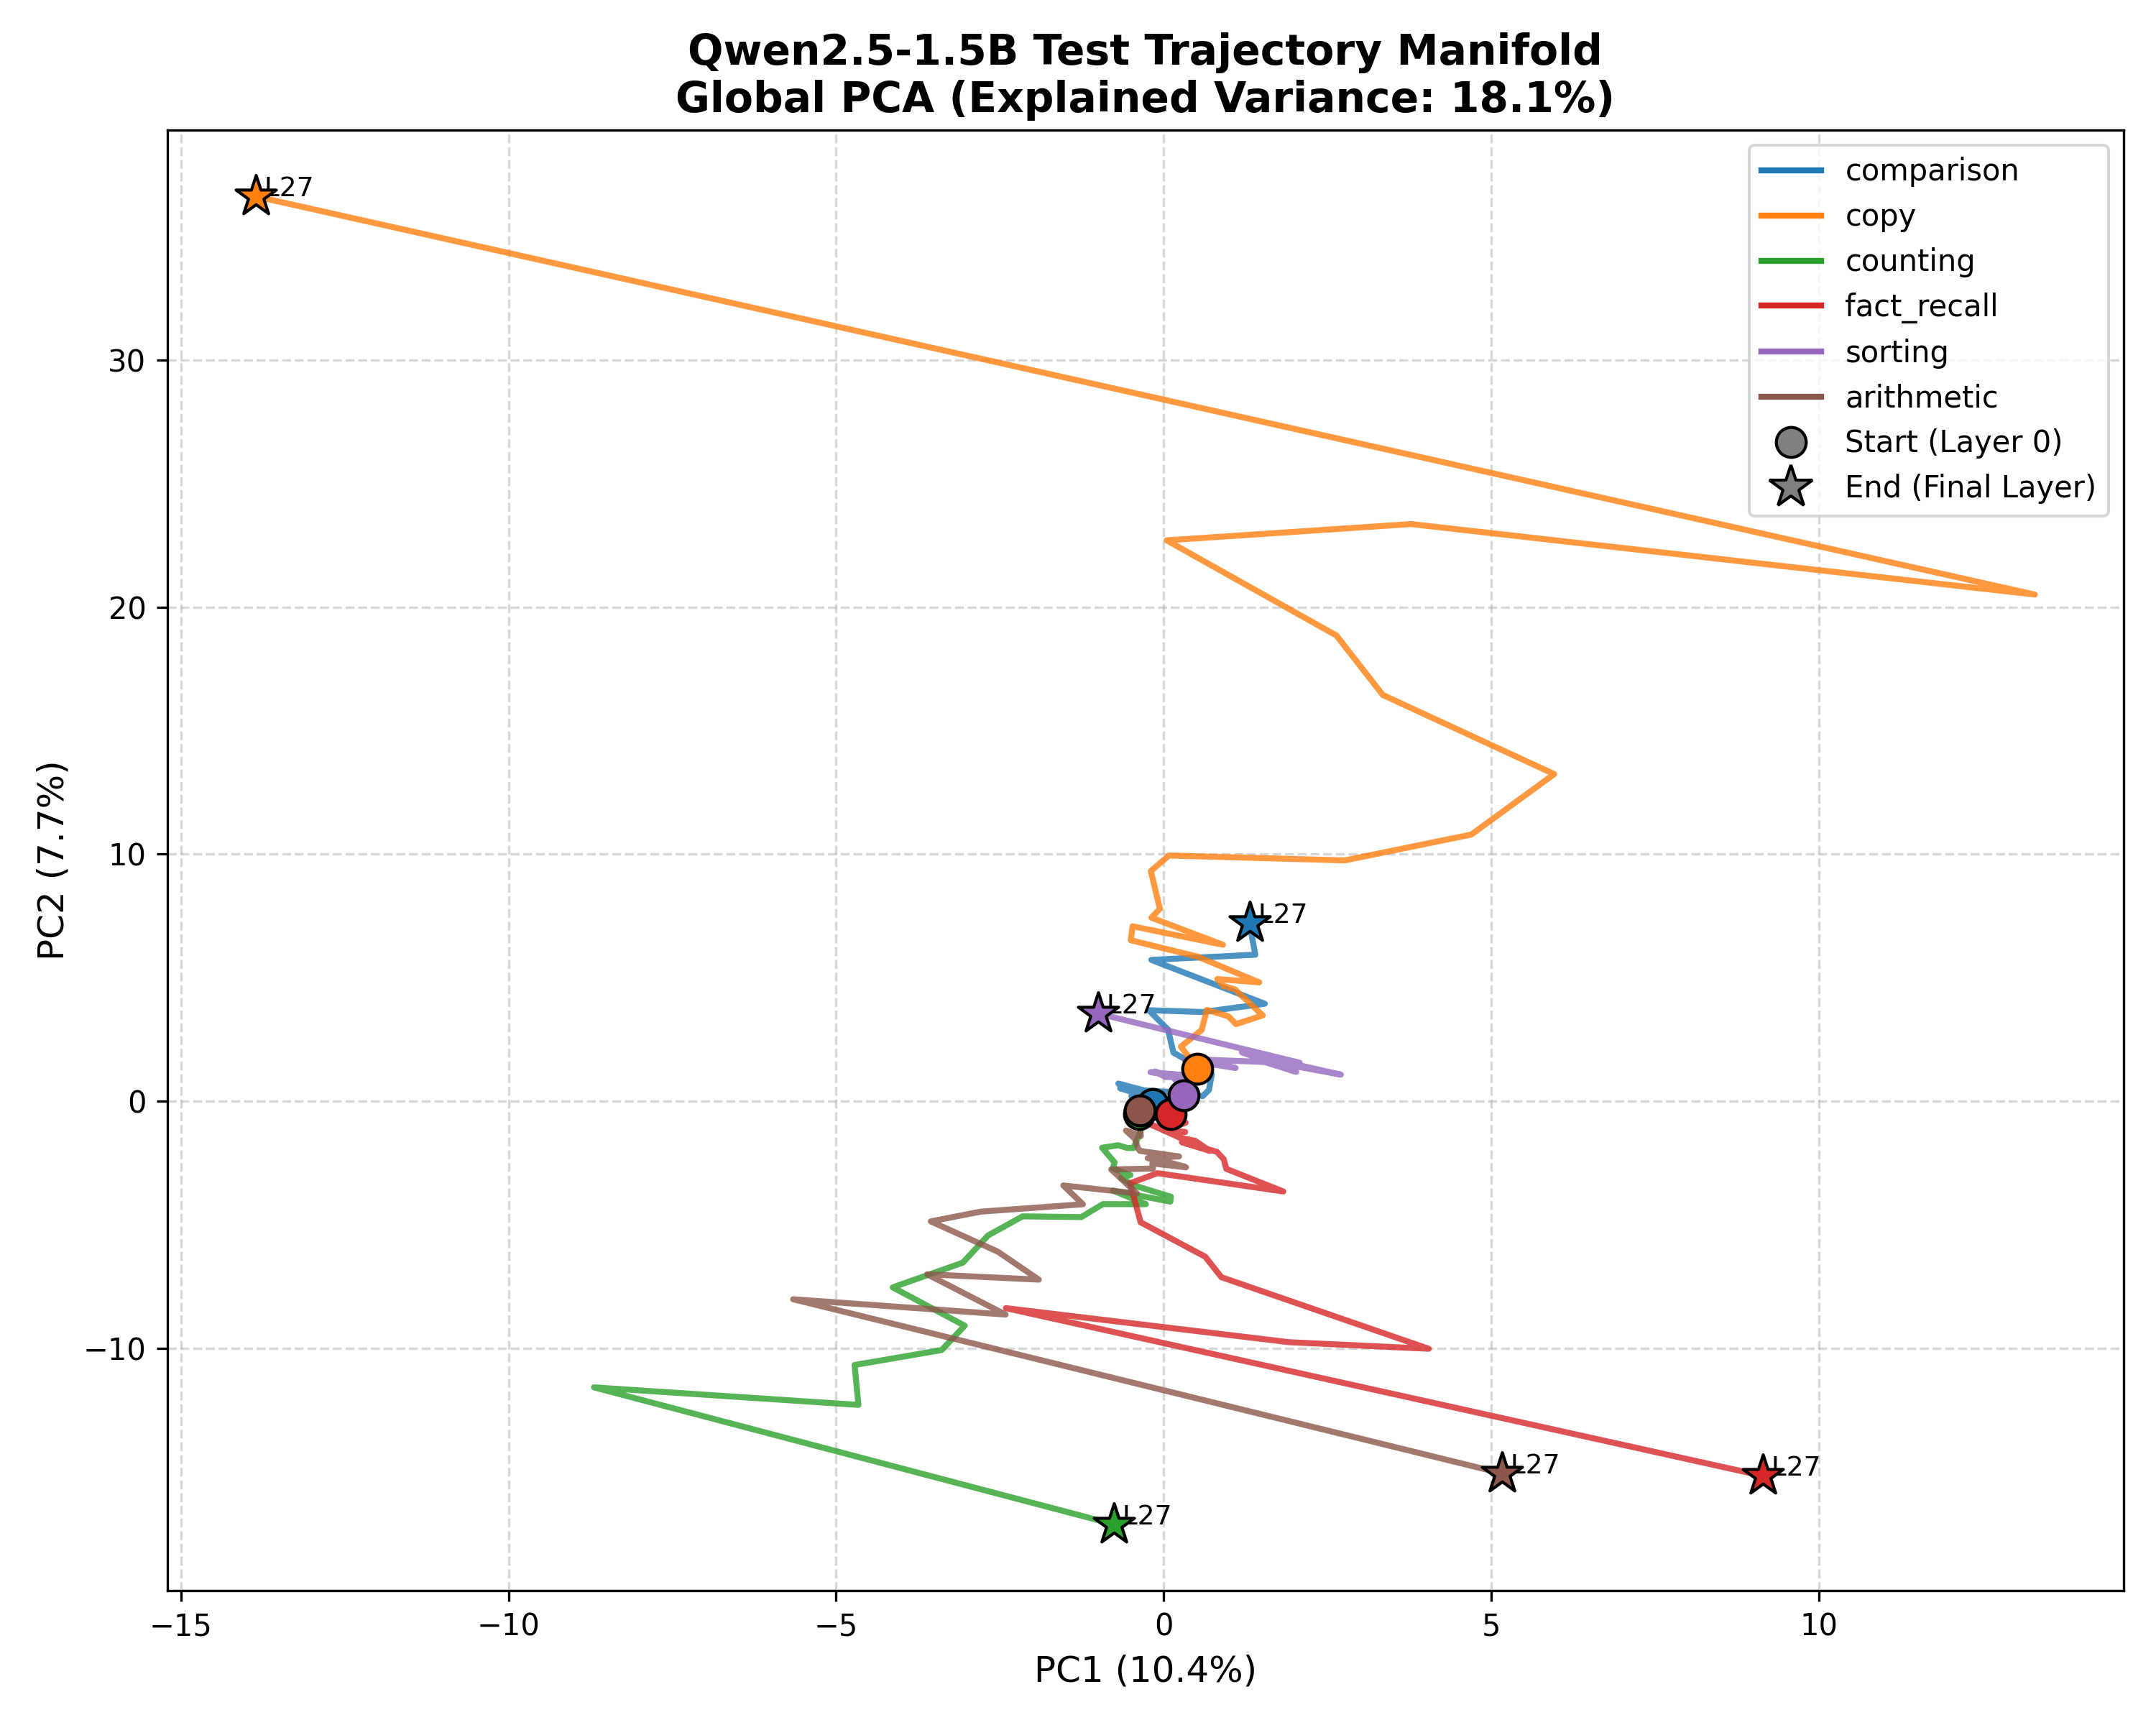
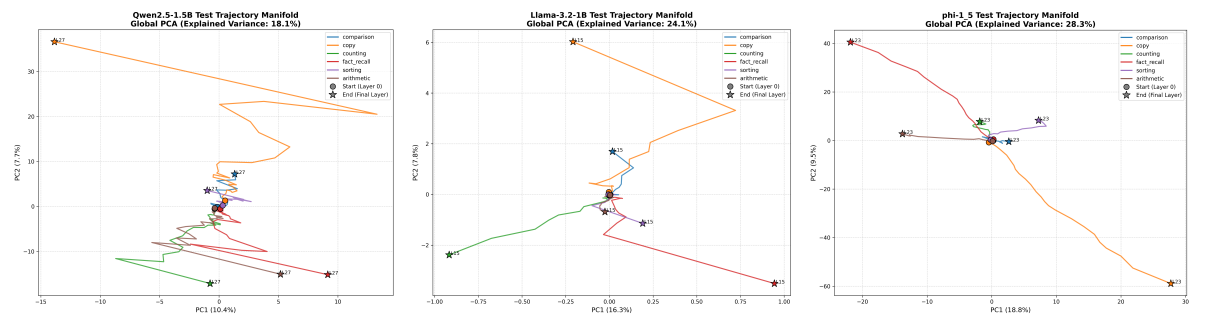
PCA projects the 1,500+ dimensional activation vector down to 2 principal directions for visualization. To prevent PCA from inventing false visual patterns in random noise, I fit PCA only on a training set and projected a completely separate, held-out validation set.
At Floor 0, all six task categories start clustered together at a shared origin (the trunk). As you climb floors, they peel apart into separate paths (the branches).
graph TD
    P1["1,536 dimensions (raw activation vector)"] --> P2["Build covariance matrix"]
    P2 --> P3["Find eigenvectors & eigenvalues"]
    P3 --> P4["Keep top 2 directions"]
    P4 --> P5["Project validation data onto basis"]
    P5 --> P6["2D coordinate plot"]
F-Statistic Verification
To prove the separation is statistically real in full high-dimensional space:
$$F = \frac{\text{spread between groups}}{\text{spread within groups}}$$
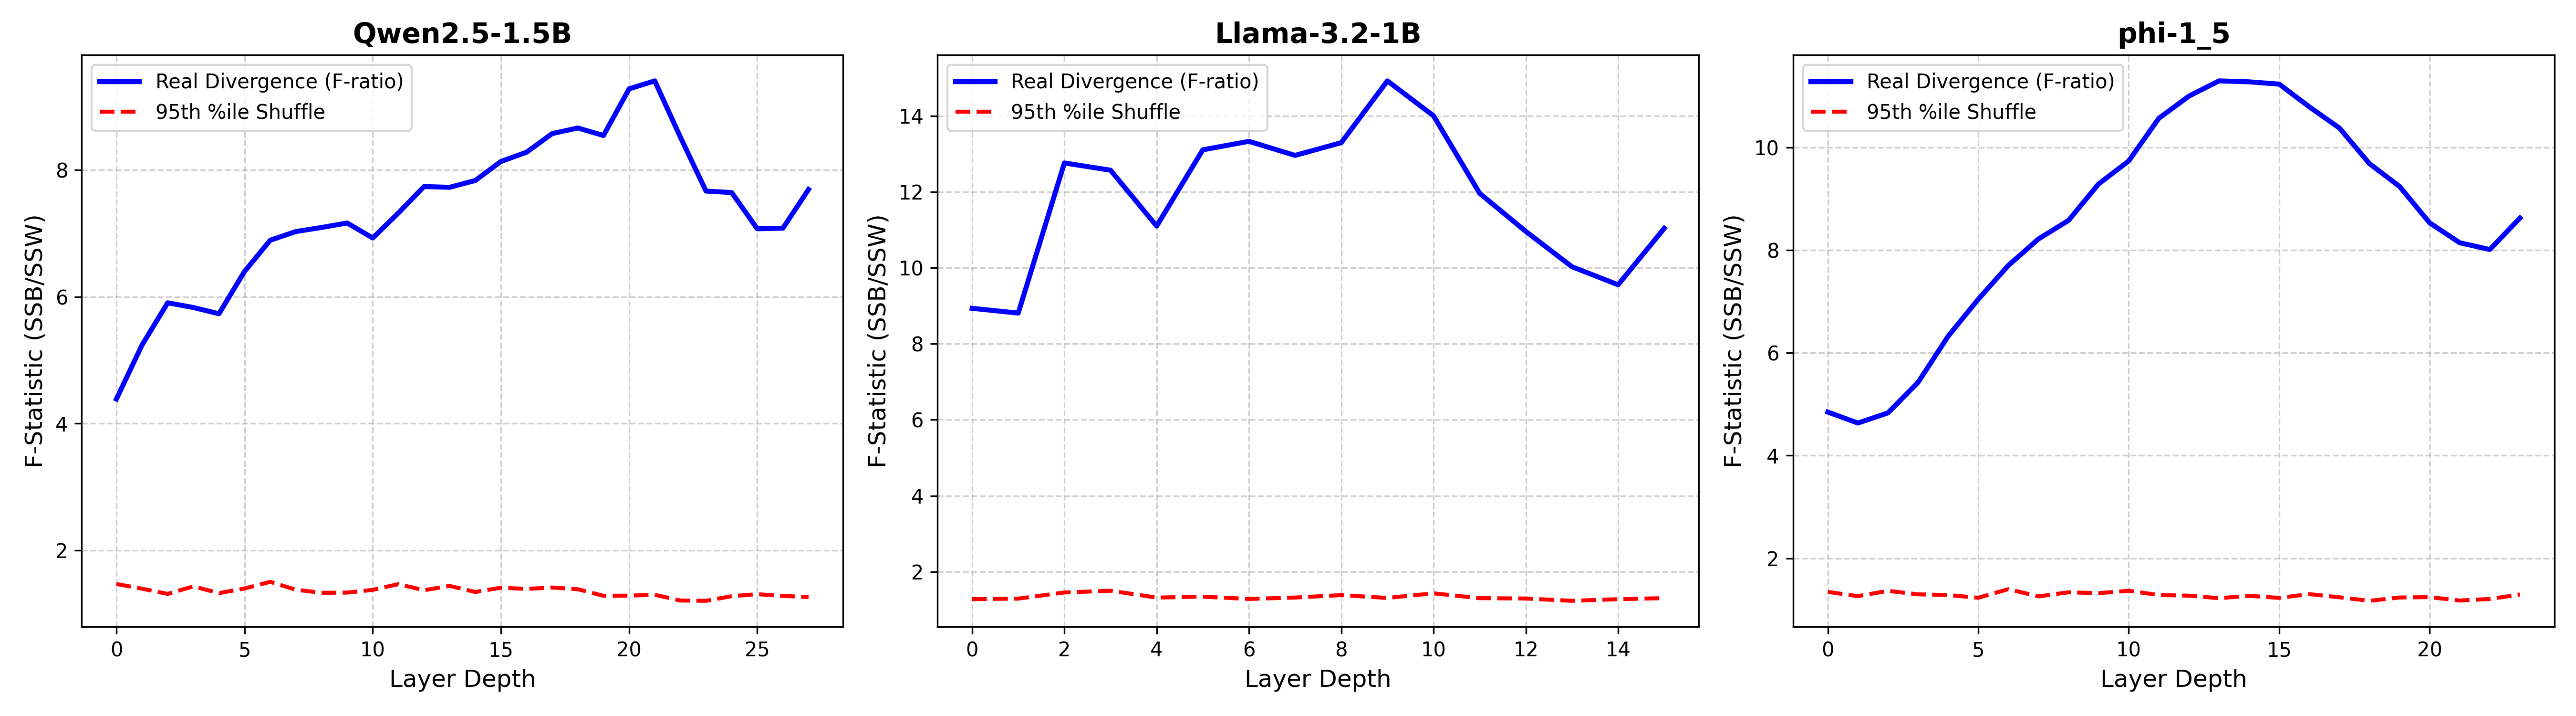
Real F-values (4 to 14) sat far above a 100-run shuffled-label control (1.2 to 1.4).
Lexical Scattering
Near the final layers, the F-statistic drops. By analyzing between-category vs. within-category spread, I found categories are not merging back together. Instead, each branch individually shatters into leaves because the model is homing in on specific output tokens ("15" vs "2" in arithmetic).
Part 3: Is This the Same Shape in Every Model?
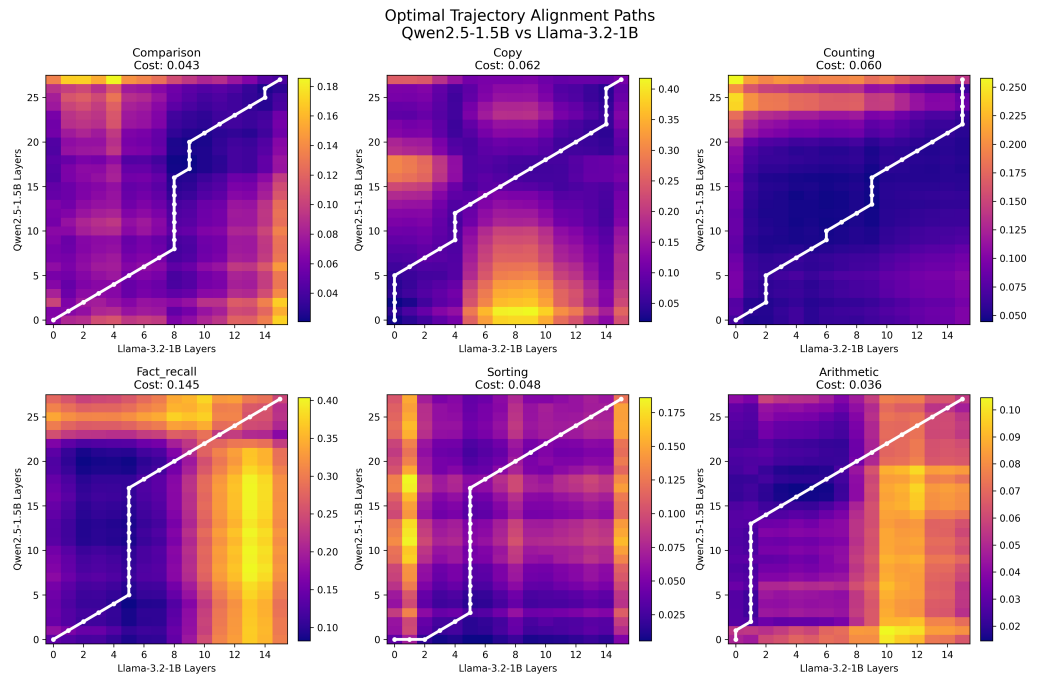
I tested three distinct architectures with different depths and hidden dimensions: Qwen2.5-1.5B (28 floors), Llama-3.2-1B (16 floors), and Phi-1.5 (24 floors).
CKA & Dynamic Time Warping (DTW)
To compare representational geometry across models of different dimensions:
- Centered Kernel Alignment (CKA): Compares Gram matrices ($N \times N$ prompt similarity tables) between models.
- Dynamic Time Warping (DTW): Aligns sequences of different layer depths using a Sakoe-Chiba band constraint.
Validation:
- Time-shuffle control: Scrambling floor order showed real alignment beat the null control by 15-20%.
- Category-confusion permutation test: In a full $6 \times 6$ grid (720 permutations), matching each category to itself yielded the minimum cost every single time ($p \approx 0.0014$).
Part 4: Does the Shape Actually Do Anything? (The Honest Null)
If geometric branching is the causal mechanism, physically injecting an “arithmetic” vector into a model processing a “sorting” prompt should force arithmetic behavior (Contrastive Activation Addition / Steering).
$$v = \text{Average(Arithmetic Activation)} - \text{Average(Sorting Activation)}$$ $$\text{Modified Activation} = \text{Normal Activation} + (3 \times v)$$
The Failure of Steering
Across 168 tests, correlation between hijack success and geometric F-ratio maturation was near zero ($r = 0.05 \text{ to } 0.11$).
Floor:    0  1  2  3  4  5  ... 11  12  13 ... 27
Hijack %: 0  0  0  0  0  0  ... 83   0   0 ... 73
Why Automated Metrics Lied
- Spike 1 (Arithmetic $\rightarrow$ Sorting) collapsed to 0% on out-of-distribution prompts (overfitting).
- Spike 2 (Fact Recall $\rightarrow$ Comparison) appeared to show 95% success. But manual inspection revealed a broken repetition loop: outputting
"not the bigger, bigger, bigger, bigger". Automated string checkers matched"bigger"and scored it as a success.
Key Takeaway: The geometric trajectory is real, but it is not a control lever. It is closer to a fingerprint or byproduct of computation—you cannot steer the car by moving the exhaust pipe.
Part 5: Who Builds This Geometry?
To decouple static orientation from dynamic movement, I evaluated:
- Static Projection: Does the component output point in the direction of the trajectory?
- Transition Contribution: What share of floor-to-floor movement does the component cause?
Finding:
- MLPs dominate positive trajectory building during the rise phase (5 MLPs contributed 80-106% of movement per floor).
- Attention heads dominate negative contribution, actively pulling the state away from the branch.
Part 6: Who Reads It Back Out?
Using Direct Logit Attribution (DLA) and mean-ablation:
- Top attention heads paid 30-34% attention to colon characters preceding answers. Mean-ablating them caused 0% drop in accuracy (correlation without causation trap).
- Ablating top 3 MLPs collapsed accuracy from 93.8% to 0.0%. However, ablating random 3 MLPs at similar depth also collapsed accuracy to 0.0%.
- Conclusion: Late-layer MLPs are generically dense and fragile; ablation alone cannot isolate a specific circuit.
Key Takeaways
- Models build a real, gradually-branching geometric structure in the residual stream corresponding to task types, conserved across architectures.
- MLPs construct this structure, while attention heads mostly oppose or refine it.
- The geometric trajectory is NOT a control switch. Injecting it produces degenerate repetition loops or null results.
- The readout mechanism is distributed and tightly coupled to generically dense, fragile late-layer representations.
Disclaimer & Open Questions
Everything in this post and the accompanying papers was conducted independently on a single laptop with an RTX 3050.
- Is there a better causal tool than mean-ablation or DLA for isolating redundant circuits in dense layers?
- Does necessity-without-sufficiency hold across instruction-tuned or larger frontier models ($>7\text{B}$)?
Feedback, criticism, and collaboration ideas are welcome.